County & State Government Dashboard
Ottawa County Source: Upjohn Institute
Explanation of the indicator:
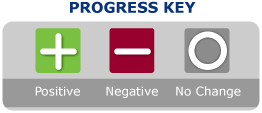
GDP (Gross Domestic Product), the primary measure of production in the U.S., refers to the quantity of goods and services produced. Positive numbers in the chart reflect a growing economy, while negative numbers reflect a shrinking economy. Real GDP, which is the GDP adjusted for inflation, is used in the chart.Notes
In some cases, County-level data are not available from the same data source used by the State. In other cases, County-level data are not available for the same time frame used by the State. In these instances, data sources and time frames were selected that most closely match those of the State. Due to this difference, it must be noted that comparisons may not be completely equivalent in all cases. Michigan's data source is the U.S. Department of Commerce, Bureau of Economic Analysis. Ottawa County’s data source is the Upjohn Institute. When this page was last updated in August 2019, 2016 data was the most recent data available for Michigan, and 2018 data was the most recent data available for Ottawa County. State of Michigan dashboard measures were last updated in December 2018 prior to the change in administration. Plans for future data updates from the new administration have not been communicated as of yet.
|

|
